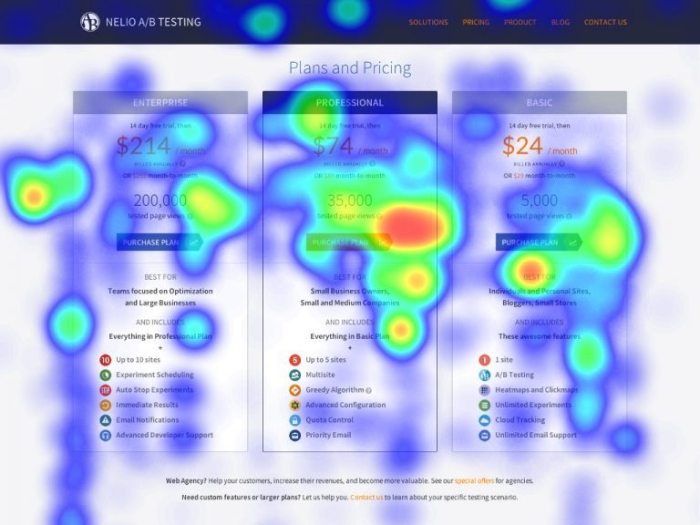
Understanding Website Heatmaps opens the door to a world of data visualization, offering businesses a unique perspective on user interaction and engagement patterns.
Dive into the realm of website analytics as we explore the intricate details of website heatmaps and their significance in optimizing user experience.
Introduction to Website Heatmaps

Website heatmaps are visual tools used in web analytics to track user interactions on a website. By displaying data in a visual format, heatmaps provide insights into user behavior, engagement, and preferences on a website.
Types of Website Heatmaps
- Click Heatmaps: Show where users click the most on a webpage, indicating popular areas of interest.
- Scroll Heatmaps: Display how far down the page users scroll, highlighting the most viewed sections.
- Move Heatmaps: Track mouse movement on a webpage, revealing areas of user interest and engagement.
Data Visualized using Website Heatmaps
- Click Density: Indicates the frequency and intensity of clicks on different elements of a webpage.
- Scroll Depth: Shows how far users scroll down a page, helping optimize content placement.
- Engagement: Illustrates user interactions such as hovers, clicks, and scrolls to understand user engagement levels.
Benefits of Using Website Heatmaps

Using website heatmaps can provide valuable insights into user behavior, helping businesses optimize their websites for better performance and user experience. Here are some key benefits of utilizing website heatmaps:
Visual Representation of User Interactions
Website heatmaps offer a visual representation of user interactions on a webpage, highlighting areas where users are most engaged or encountering issues. This helps in identifying popular sections of a website and areas that may need improvement.
Identifying User Trends and Patterns
By analyzing website heatmaps, businesses can identify user trends and patterns, such as where users are clicking the most, how far they scroll down a page, or which elements they are interacting with. This data can be used to make informed decisions on website layout and content placement.
Comparing Performance Across Devices
Website heatmaps allow businesses to compare user behavior and engagement across different devices, such as desktops, tablets, and mobile phones. This insight is crucial for ensuring a seamless user experience across all devices.
Optimizing Call-to-Actions (CTAs)
With website heatmaps, businesses can track how users are interacting with call-to-action buttons and links. This information helps in optimizing CTAs for better conversion rates and guiding users towards desired actions on the website.
Improving User Experience
Ultimately, website heatmaps help in improving overall user experience by providing actionable data on how users navigate and engage with a website. By making data-driven changes based on heatmap analysis, businesses can enhance user satisfaction and drive conversions.
Types of Website Heatmaps: Understanding Website Heatmaps
Website heatmaps come in various types, each providing unique insights into user behavior and interaction with a website. Let’s explore the different types of website heatmaps and how they offer valuable optimization opportunities.
Click Maps
Click maps visualize where users are clicking on a webpage, showing hotspots of user activity. By analyzing click maps, website owners can identify popular areas on a page, determine which elements attract the most attention, and optimize the placement of important buttons or links for better user engagement.
Scroll Maps
Scroll maps track how far down a page users scroll before leaving, indicating where users lose interest or abandon the page. By studying scroll maps, website owners can optimize content placement, adjust the length of pages, and ensure that crucial information is visible without excessive scrolling.
Movement Maps
Movement maps display the movement of the cursor across a webpage, highlighting areas of interest and patterns of user attention. By examining movement maps, website owners can understand how users navigate through the page, identify confusing elements or distractions, and improve the overall user experience by streamlining navigation paths.Each type of heatmap offers valuable insights into user behavior, allowing website owners to make data-driven decisions for optimizing their websites and enhancing user engagement.
Understanding User Behavior through Heatmaps
Website heatmaps play a crucial role in understanding how users engage with a website and their interaction patterns. By analyzing heatmap data, website owners and developers can gain valuable insights into user behavior, allowing them to make informed decisions for website improvements.
Interpreting Heatmap Data
Interpreting heatmap data involves looking at various elements such as click heatmaps, scroll heatmaps, and mouse movement heatmaps. Understanding where users are clicking the most, how far they are scrolling down a page, and where their mouse hovers can provide valuable information on user behavior.
Analyzing User Behavior Effectively, Understanding Website Heatmaps
- Focus on hotspots: Pay attention to areas of high activity on heatmaps, as these indicate where users are most engaged.
- Identify cold spots: Look for areas with low interaction, as these may require optimization to improve user engagement.
- Compare different heatmaps: Analyzing different types of heatmaps together can provide a more comprehensive view of user behavior.
- Track changes over time: Regularly analyzing heatmap data can help track changes in user behavior and the impact of website modifications.


